When TIPS Outperform and How I Invest in Them
An analysis of when inflation-protected bonds outperform (and underperform) regular bonds.

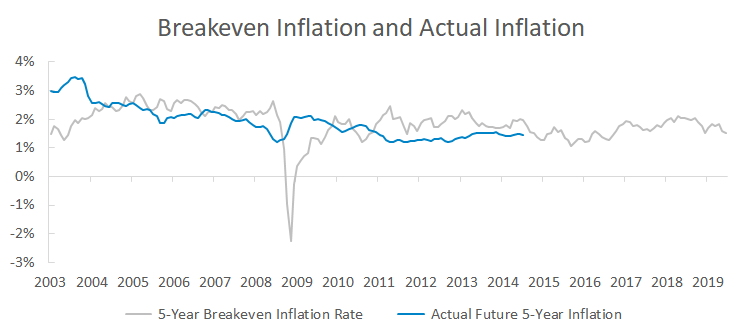
TIPS outperform regular Treasuries when the market underestimates future inflation.
The chart below shows the 5-year breakeven rate and actual future inflation.
Sources and Disclosures
Data from the St. Louis Federal Reserve Economic Database.
The market has typically overestimated inflation, although expectations in 2003 and 2008 were overly conservative and TIPS went on to outperform.
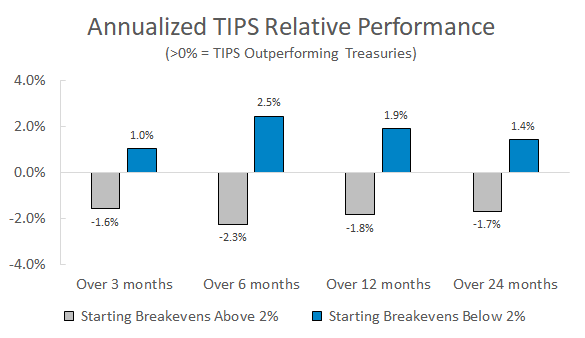
I use breakeven rates as a way to see if TIPS are trading expensive or cheap relative to regular Treasuries. The chart below groups TIPS performance into periods when 10-year breakevens were above and below 2%.
For example, the 12 month blue bar shows that TIPS have outperformed regular Treasuries by 1.9% on average over the next 12 months when the starting 10-year breakeven inflation rate was below 2%.
Sources and Disclosures
TIPS and Treasury performance data uses TIP and VIPSX for TIPS (VIPSX when data for TIP is unavailable) and IEF for regular Treasuries. These are all intermediate-term bond ETFs with similar durations. All data includes reinvested bond interest. All returns shown are hypothetical, simulated, and are not an indicator of future results.
The GIF below provides more detail and shows daily breakevens and future relative TIPS performance.
Any dots above 0% on the y-axis mean TIPS outperformed regular Treasuries over that time horizon.
Sources and Disclosures
TIPS and Treasury performance data uses TIP and VIPSX for TIPS (VIPSX when data for TIP is unavailable) and IEF for regular Treasuries. These are all intermediate-term bond ETFs with similar durations. All data includes reinvested bond interest. All returns shown are hypothetical, simulated, and are not an indicator of future results.
There’s a positive correlation between starting breakevens and future TIPS performance relative to Treasuries, particularly for longer time horizons. The current 10-year breakeven rate of 1.77% has historically been associated with TIPS outperforming regular Treasuries by 1.3% over the next twelve months.
How I Use TIPS
An investor that only allocates to regular bonds is vulnerable to higher than expected inflation, yet solely using TIPS would result in underperformance if future inflation is less than expected.
I own an equal amount of regular and inflation-protected bonds to avoid making a bet on the direction of inflation. Just as investors have consistently failed to forecast future interest rates, I’m confident nobody truly knows where inflation is headed.
I mainly use Vanguard’s VTIP ETF and occasionally buy individual TIPS bonds when someone wants to target a specific amount of future inflation-adjusted cash flow.
Summary
This post wraps up my series on TIPS. Main takeaways:
- Part 1: Inflation-indexed bonds were first used in the Revolutionary War and make up only 2% of the global market portfolio.
- Part 2: Regular bonds have historically lost more than 60% after inflation. TIPS protect against this.
- Part 3: The mispricing of TIPS in 2008 was the largest ever documented arbitrage.
- Part 4: TIPS are not tax disadvantaged relative to other taxable bonds.
- Part 5: Breakeven inflation rates are correlated with TIPS performance and I use a 50/50 split between regular bonds and TIPS.
I hope these posts were useful and feel free to get in contact if you have any questions.