The True Cost of Commodity ETFs
An in-depth explainer on the trading costs, roll yields, and different structures of commodity ETFs.

Investors recently piled into funds that try to provide direct exposure to the price of oil:

Most commodity ETFs own contracts for future delivery, not the physical commodity itself. Future contracts expire every month or so and funds then have to trade into new contracts. This introduces unique costs for commodity ETFs and this post explains how they work.
Cost #1: Rolling Futures
The cost of rolling into new contracts is the main reason ETF returns differ from physical commodity prices:
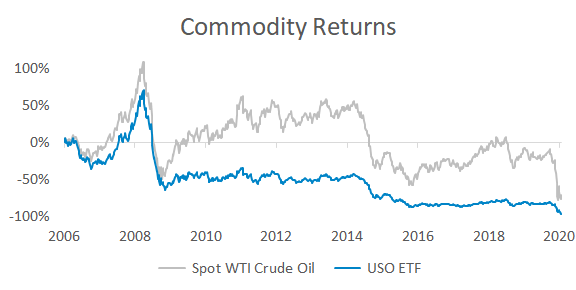
That chart is deceiving because it implies you’re better off buying physical oil compared to the ETF. In reality, you would have paid to store the oil and commodity futures accurately reflect those storage costs.
For example, you can put $100k of gold in a safe deposit box for $20 per year. Storing $100k of oil is more expensive. That’s why the gold futures curve is flat and oil futures typically increase over time:
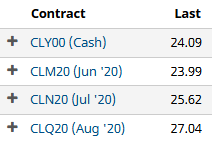
The need to constantly roll futures is the biggest cost for most commodity ETFs. For example, the spot price of WTI crude is $24.09 and futures expiring a year from now trade at $32.65. If you buy those futures today and spot prices are the same next year then you’ll lose 26% as the futures converge with lower spot prices.
“The cost of rolling futures contracts, rather than the decline in commodity prices, has been the largest drag on commodity index performance over the past 10 years.“ - Two Sigma
Roll costs change daily, but here’s a current snapshot for someone wanting to buy futures expiring next May:
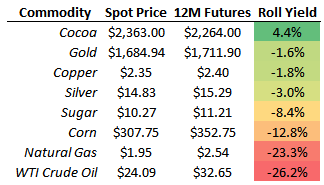
Cocoa futures are actually cheaper than spot prices. Assuming the cocoa curve stays the same, futures will rise to meet spot prices at expiration. In this case there’s an expected benefit, not cost, to owning futures.
ETFs use a variety of rolling strategies:
- Front Month: Owns the immediate contract and rolls before it expires. Front month futures are more sensitive to spot prices, so these funds tend to be more volatile. One example is UNG for natural gas.
- Laddered: Owns several contracts to reduce the amount they have to roll in a given contract month. USO for crude oil recently changed to a laddered strategy.
- Optimized: These choose contracts that have the lowest roll costs. For example, DBO is USO’s biggest competitor and their optimized roll strategy has led to 32% in outperformance this year.
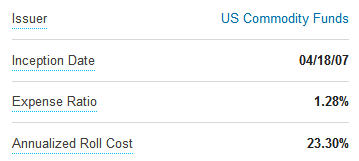
In an ideal world ETF issuers would be transparent about roll costs, maybe like so:
The last thing to know about roll costs is when they impact your returns. There’s a common misconception that goes “If you own June futures at $25 and have to roll up to July futures at $27 then you lose the difference.”
Imagine you owned $300 of a stock priced at $50 per share and replaced it with a stock priced at $75. You didn’t lose money by trading into something with a different price. It’s the same dynamic with futures – rolling doesn’t create or destroy wealth.
Losses occur over time, not the day a roll happens. Negative roll yields that currently exist in most contracts create a drag on returns, but the effect is gradual and changes as futures shift in price.
Cost #2: Market Impact
The popularity of some ETFs makes it expensive for them to roll their portfolio. A paper from 2012 estimated that USO’s market impact cost them 3% per year:
“Accumulated trading costs of 3% per year are substantial. These costs arise from the large amount of liquidity demanded by USO’s monthly roll strategy.” - Liquidity, Resiliency and Market Quality Around Predictable Trades
Trading costs are only an issue if a fund holds a large percentage of the contracts for a given month. The corn ETF owns 1,325 of the 619,868 July corn futures, so their trading isn’t going to effect returns. But investors in USO, UNG, and DBO should expect material trading costs. For example, UNG owns 22,813 June futures when the open interest for that contract is 224,752.
Another trading cost has less to do with liquidity and more to do with information. Imagine if Warren Buffett said “I’m going to buy $10 billion of AAPL on May 15.” People would front run him. The same thing happens in commodity markets – traders get in front of commodity rolls because index publishers announce them:

Here’s the roll schedule for USO:
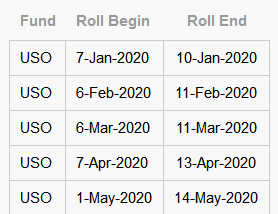
Notice how they recently expanded the window from four to ten business days. They did this to lower trading costs as the fund has attracted interest from oil investors. Trading costs are tougher to measure than roll costs, but the main takeaway is that if an ETF dominates a contract month then you should expect a slight reduction in fund returns.
Cost #3: Fund Structure
The structure of a commodity ETF can result in drastically different tax bills. There are four main types:
- Grantor Trusts: These own physical commodities like gold and avoid rolling costs. The IRS treats them as collectibles, so short-term capital gains are taxed as ordinary income and long-term gains are taxed at 28%.
- Limited Partnerships: Profits are taxed 60% at long-term rates and 40% short-term regardless of the holding period. LPs generate a K1 form and mark their portfolio to market each year, so you’ll owe tax on any gains even if you didn’t sell the fund.
- ETNs: These are debt obligations of banks that guarantee the ETNs will track an index. One advantage (for long-term owners) is that they’re taxed like regular securities. Be wary of credit risk though, an ETN can become worthless if the issuer defaults.
- No K1 Funds: These came out a few years ago as an “improved” version of the LP structure. They don’t trigger a K1 but they do have two downsides. Losses can’t be carried forward and capital gains get converted into distributions taxed as income.
Here’s a summary of what two hypothetical investors would owe:

While partnerships have the reputation of being a tax hassle due to the K1 forms, they’re actually a tax-efficient structure for most investors. Especially for those in a low bracket married filing jointly since they owe 0% on long-term gains.
Summary
- Roll costs can exceed fund fees and are different for each commodity and rolling strategy.
- Funds with concentrated positions can incur significant trading costs.
- Be careful about the commodity ETF you use in taxable accounts.
