The Faulty Assumption Behind 3 Scary Charts
This post explores the common thread between charts on valuations, economic expansions, and expected returns.

A belief in steady and predictable mean reversion has cost investors a lot of money this cycle.
The problem with applying mean reversion to investing is that market averages are not written in stone.
Here are three examples:
CAPE Ratio
If there was a contest for the chart that’s spooked the most investors since 2009, I’m confident this would win:
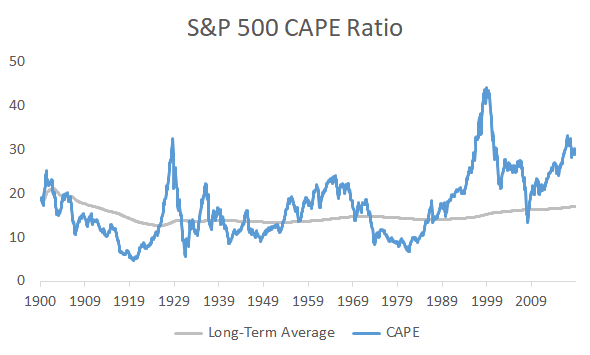
The S&P 500 has traded above its historical CAPE average 97% of the time since the last recession. A strategy that avoids stocks when valuations are above average would have exited the market in May 2009. A model that only invested 3% of the time during the longest U.S. bull market isn’t temporarily wrong – it’s broken.
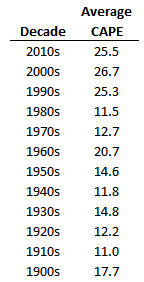
CAPE seemed elevated in 1992 when it was 20 and the average was 14. Nobody knew the average CAPE since then would be 27.
The danger with strict mean reversion models is that the mean always changes:
There are three potential reasons for higher stock valuations:
- Markets are cheaper to access. In 50 years we went from steep trading costs to essentially free global investing. You can wake up and buy $1 million of international stocks then sell after lunch if you change your mind.
- We know more about long-term returns. An investor in 1920 was flying blind and had no historical precedent for long-term stock and bond returns. Modern investors have more data about what works (and what doesn’t).
- Diversification is more convenient. Rather than spend time building a portfolio of individual stocks or bonds, modern investors can instantly diversify between thousands of securities in a single fund.
It’s reasonable to pay a higher valuation for the above luxuries.
That said, I doubt they’re free lunches and expect we’ll pay for them through lower future returns.
Economic Cycle Length
The current U.S. economic expansion is now the longest ever:
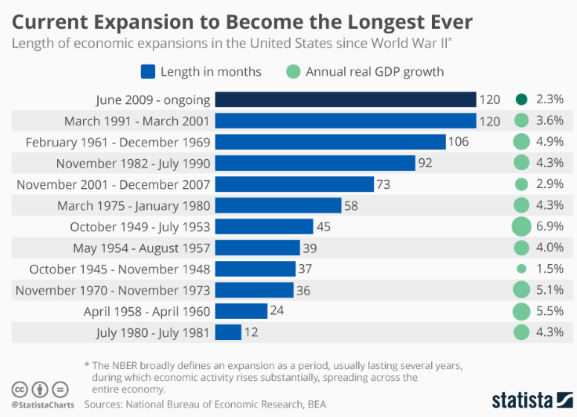
As soon as it eclipsed the historical average people were calling for mean reversion:

Like with CAPE, the mean has shifted over time. The average expansion from 1854 to 1919 lasted two years while the past four expansions have averaged eight years. One reason why cycles have grown longer is that the U.S. economy has become more diversified. Manufacturing and agriculture no longer make up the majority of the U.S. economy.
The length of this cycle is unprecedented in the U.S. but other countries have experienced far longer expansions. Economies aren’t clocks that follow a predictable pattern and expansions don’t end because they reach a certain age.
Return Expectations
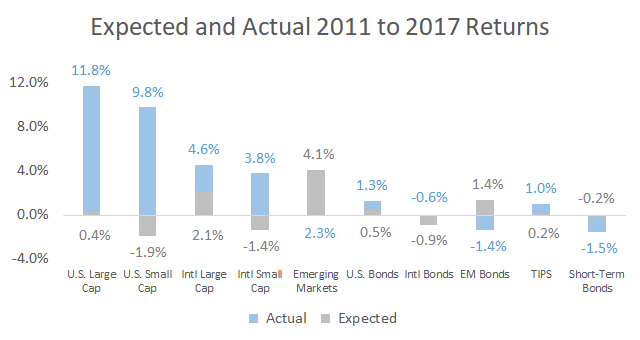
Mean reverting frameworks are used to forecast returns and GMO’s are some of the most popular.
Here’s what they predicted in 2010:
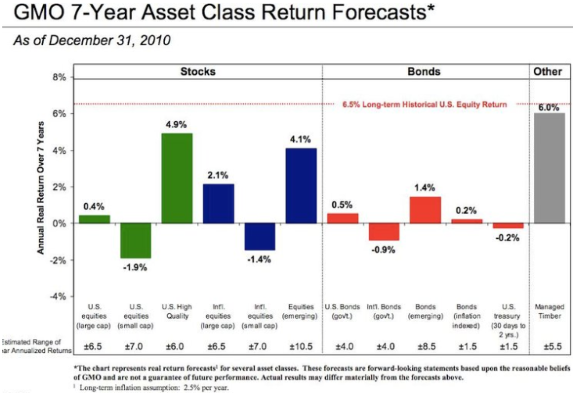
What actually happened:
To his credit, Jeremy Grantham has since said:
“The market was extremely well-behaved from 1935 until 2000. The market outperformed when it was it cheap, and when it got expensive, it cracked. Since 2000, it’s become much more complicated. The rules have shifted. We used to say that this time is never different. I think what has happened from 2000 until today is a challenge to that.“Jeremy Grantham
Valuations matter, but they’re overused to give a sense of false precision about what the future will hold.
Summary
“Much of what we know about investing comes from U.S. data in the 20th century. And when you take the most mean-reverting, stable market of all time, all kinds of mean reversion are going to work for you. My concern is that maybe we’re taking rules that were developed for the most mean-reverting, stable market of all time and trying to apply them in a new world order where markets might be reverting, but we don’t know to what.”Aswath Damodaran
Mean reversion can take eons and isn’t powerful enough to guarantee a predictable investing outcome