Summarizing the Case for International Stocks
This post answers the “why” and “how much” of international stock exposure.

Imagine you took a time machine back to 2007. This is what the rear-view mirror looked like for U.S. and international stocks:
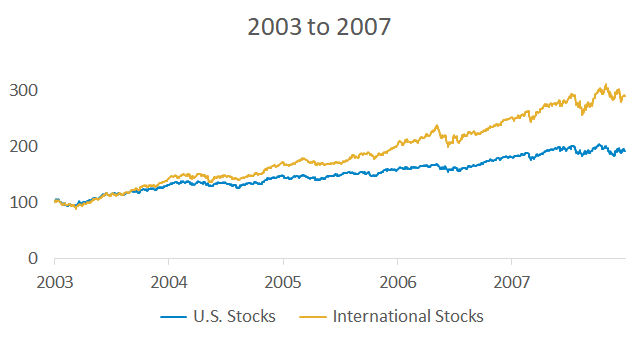
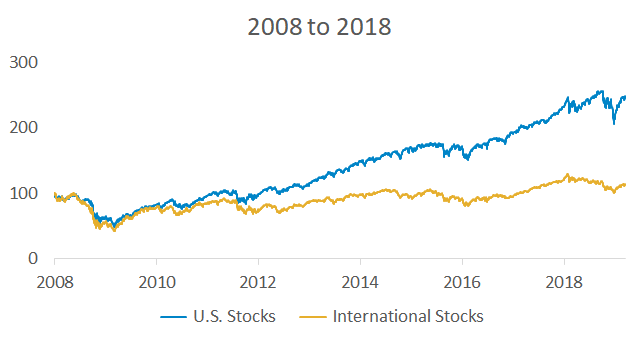
International stocks substantially outperformed and U.S. investors missed out by sticking close to home. Since 2007, the roles have reversed and U.S. stocks have generated higher returns.
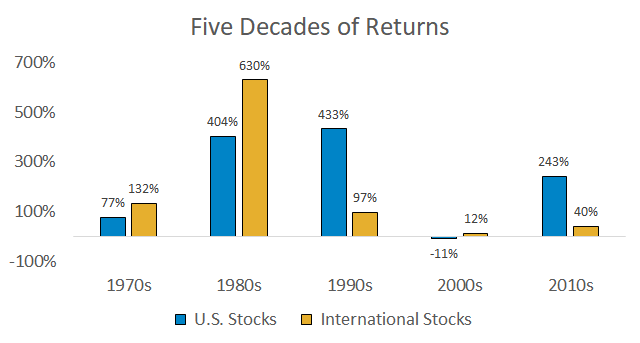
The chart below shows U.S. and international stock performance over the past five decades. For those who want even longer-term data, this paper covers global stock returns since 1921.
Many investors are now looking at their portfolios and asking “Why do I own international stocks if they’ve done so poorly over the past few years?” Current sentiment is opposite of what we saw in the mid-2000s: exuberant optimism over foreign investing and the rapid growth of BRIC nations. This makes sense – sentiment tends to chase performance, and international stocks did well in the mid-2000s.
Investors without a plan typically buy what they wish they bought years ago. This performance chasing behavior leads to chronic underperformance. The goal of this post is to explain the “why” and “how much” of international stocks since investors should know why they own them and if their current domestic/international split makes sense.
Diversification
The main reason to own international stocks is to minimize the chance of unfavorable portfolio outcomes. Index fund investors say, “I don’t know which individual stock or bond will perform the best so I just want to own them all.” Data is proving this logic to be sound – index funds recently outperformed the average stock picking mutual fund for the ninth year in a row.
Most stock market gains come from a small number of big winners. The chances of selecting these winners in advance are extremely low.
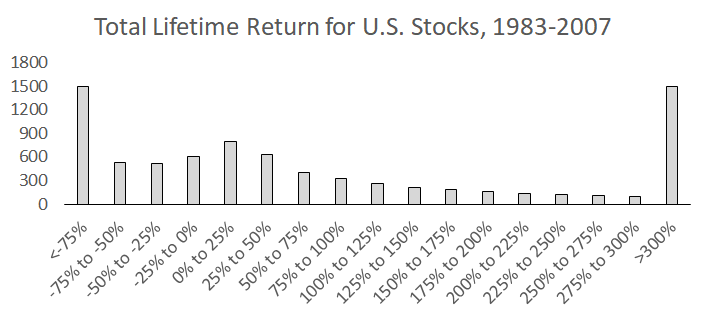
Last year, a study found that “four out of every seven common stocks that have appeared in the CRSP database since 1926 have lifetime buy-and-hold returns less than one-month Treasuries.” This is a pretty crazy statistic – greater than 50% of risky common stocks underperformed risk-free Treasury bills. One of the major reasons why most active stock picking mutual funds underperform is because there’s a low probability they’ll own the few stocks that do really well. High fees also set a high hurdle for index outperformance.
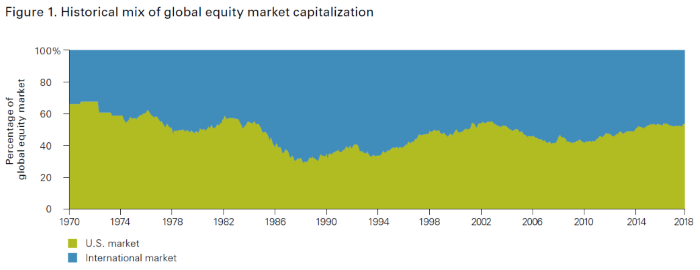
So when it comes to stock selection, rather than search for a needle in a haystack, index fund investors buy the whole haystack. An investor only using U.S. stock index funds is not completely diversified though – there’s more than just the U.S. stock haystack. The graph below shows that U.S. stocks make up roughly half of the global stock market.
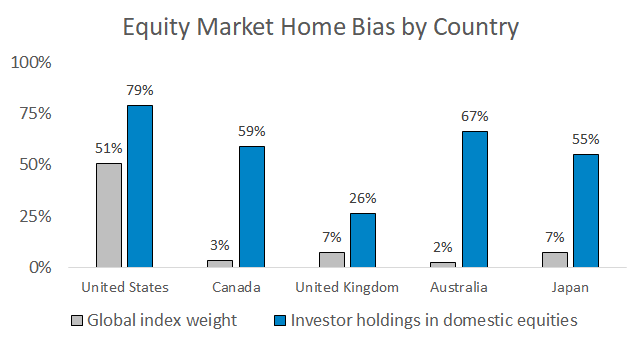
The average U.S. investor has 79% of their stock exposure in U.S. stocks, higher than their 51% global market share.
An optimal allocation split between U.S. and international stocks only exists in hindsight. In reality, the best allocation is the one you’ll actually stick with over the long run. The domestic/international split I use in the passive portion of client accounts is 50% in U.S. stocks through VTI and 50% in international stocks through VXUS, since this is a truly passive representation of the global stock market.
Cheaper Valuations
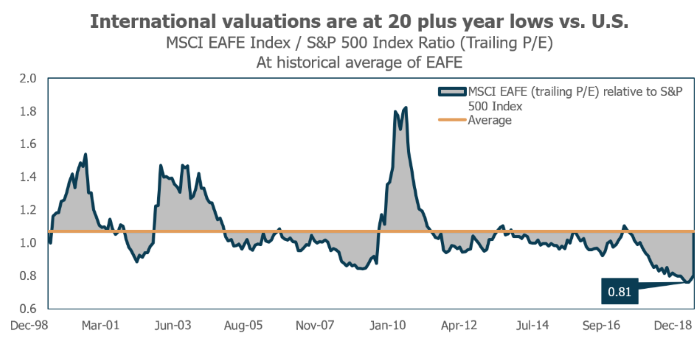
Current valuations point to a higher probability of international stocks outperforming U.S. stocks over the next decade. The graph below shows that international stock valuations haven’t been this low relative to the U.S. in 20 years.
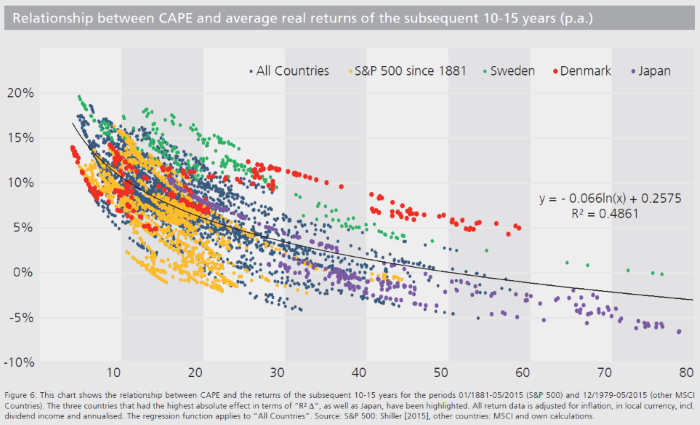
International stocks are also cheap on an absolute basis. A large number of major international stock markets like Japan, Germany, and Australia currently trade at CAPE ratios below 20. The chart below shows the strong historical relationship between starting valuations (x-axis) and future long-term returns (y-axis).
Investors sometimes get caught up in minutiae when measuring valuations. They try to pick the best valuation ratio, the right time period, etc. But the big picture relationship between valuations and returns is easy to understand. Expensive assets eventually price in perfection, reality doesn’t measure up to overly optimistic expectations, and the expensive asset becomes cheaper. Cheap assets are cheap because investors have abandoned them and no longer expect anything positive to happen. These expectations end up being overly pessimistic and cheap assets rise in value as expectations are adjusted higher.
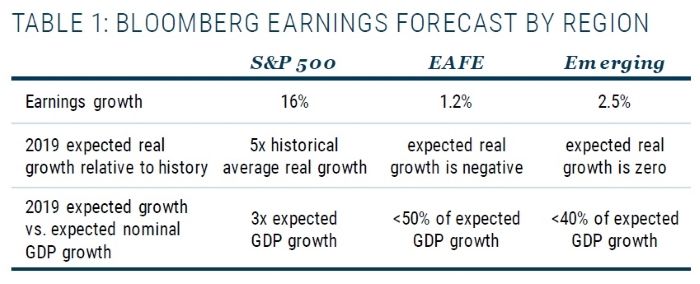
A recent note from GMO shows just how pessimistic analysts are on future international stock earnings.
I should note that valuation-based market timing is extremely tough. Expensive markets tend to stay richly valued for longer than anyone thinks possible (see: 1996 to 1999) and cheap markets tend to stay cheaper for long periods of time (see: 1975 to 1982). To me, valuations are useful only in their ability to create realistic 10-year return expectations. I think of valuations as a portfolio barometer and not a tactical tool to adjust equity exposure.
Cheaper valuations are a welcome feature of international stock exposure in 2019, but obviously current valuations are fleeting so I don’t consider valuations to be a long-term benefit of international exposure.
Inflation Hedging
Research shows that international stocks have historically provided a more effective inflation hedge than domestic stocks.
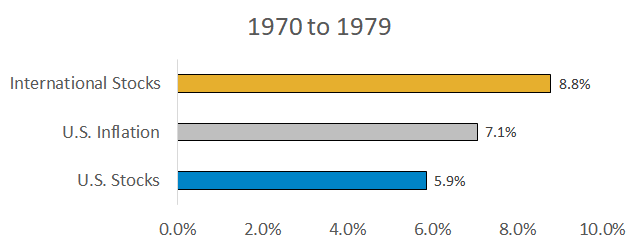
One example of this is shown below. The chart shows compound annualized returns during the 1970s. U.S. inflation grew at 7.1% per year, meaning U.S. stocks that returned 5.9% provided a negative inflation-adjusted return. International stocks outperformed, primarily because the foreign currencies they were denominated in appreciated relative to the falling U.S. dollar.
Summary
Three benefits of international stock exposure are:
- Additional diversification
- Cheaper valuations (for now)
- Inflation protection
Global diversification works whether we want it to or not, as the last few years have shown. Now is a great time for U.S. investors to revisit their international allocations for the above reasons.